When a strategy works, the risk is not noticing when it stops. Freeze a baseline for each version, compare every new trade against it and catch execution drift before it reaches your P&L.
Deterministic behavior detection. No signals. No predictions.
Strategy Tracking
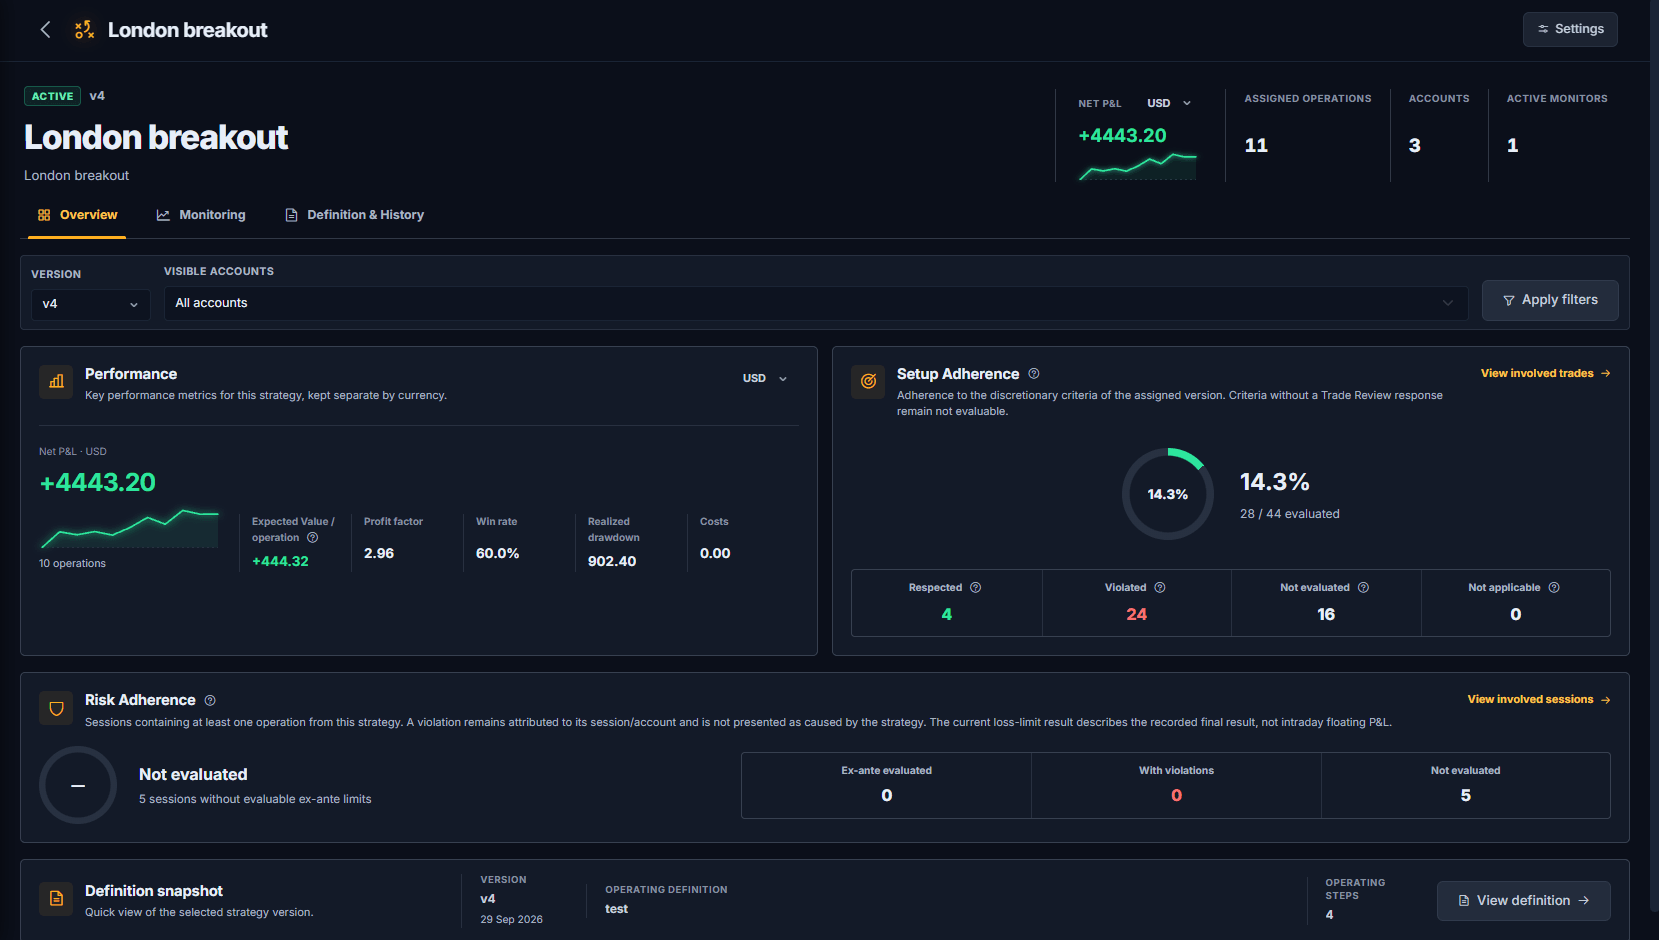
London breakout
v4 · USD · 10 operations
Active
Net P&L · USD
Net P&L
+0.00
Expected Value
+0.00 R / op
Profit factor
2.96
Real interface · recorded sample, not expected results
Sound familiar?
Your strategy works and you want to keep it that way
You need to know early when the numbers drift away from your reference.
You tweak a rule and lose the comparison
After a few changes it is no longer clear what worked, and when.
You trade several accounts
You want to follow the same model everywhere without mixing currencies and results.
From baseline to decision.
A fixed reference for every version, and the evidence to decide.
01
Organize trades by strategy and version
Import or sync your trades and assign them to the version you executed, in bulk if needed. Published versions never change: history stays linked to the model used at the time.
Strategy Tracking
02
Freeze a baseline
Create a monitor: version, accounts, trade sample and metrics become the reference. Late imports and reassignments never rewrite it.
Monitor
03
Compare every new trade
Trades after the baseline update after every sync, side by side with the reference: Expected Value in R, profit factor, win rate and drawdown.
Since baseline · live
04
Watch execution, not just results
Setup Adherence and Risk Adherence show whether you are following the model. Discipline OS flags drift, such as rules loosening or size creeping up.
Adherence · Discipline OS
05
Decide with evidence
Record your decision (continue, investigate, pause or create a new version) with a note: every review keeps the metrics visible at that moment.
Strategy Review
Three tools, in detail.
What each one does, what you get and which data it needs.
Strategy Tracking. Know if your edge still holds.
Define each strategy and its versions, assign trades to the model you actually executed, and follow results per version and per account. When you change the model, the previous version and its history stay intact, so comparisons stay honest.
Performance per strategy and version: net P&L, Expected Value in R, profit factor, win rate and drawdown.
Setup adherence from your Trade Review answers, kept separate from calculated checks.
Monitors that freeze a baseline and compare new trades against it.
The same strategy across several accounts, with currencies kept separate.
Product interface · recorded example. Values refer to the displayed sample, not expected results.Scroll the preview or open it full screen.
Discipline OS. Find what costs you, then test the fix.
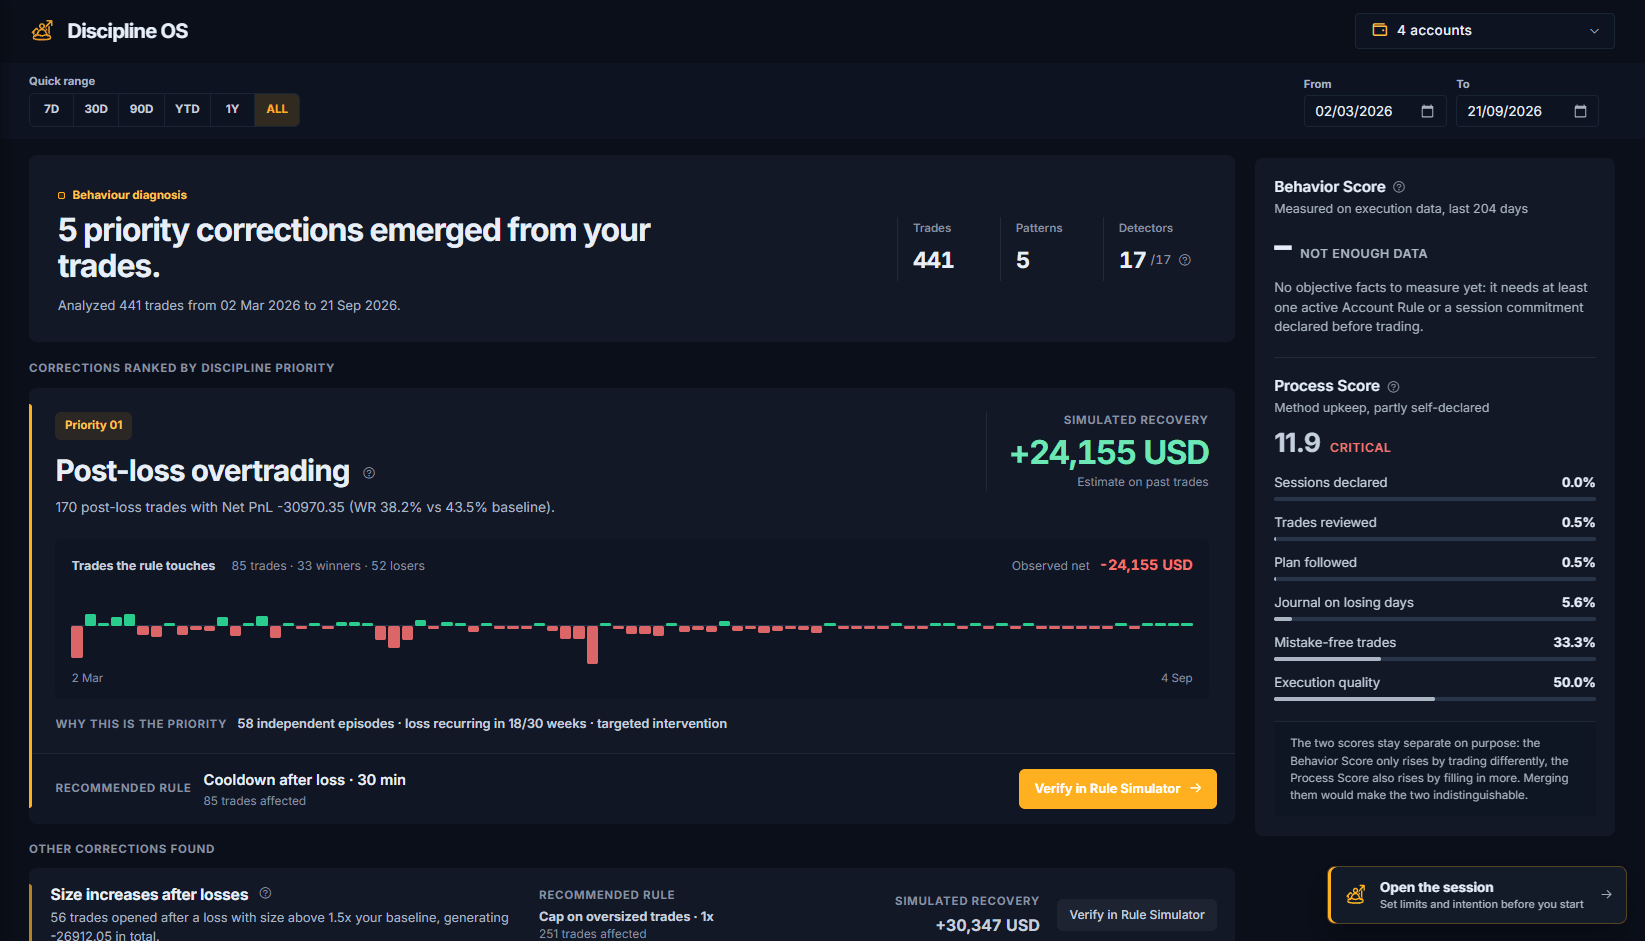
17 deterministic detectors scan your history for behavioral patterns, such as overtrading after a loss, weak time blocks or rules drifting, and rank them by measured impact. Every finding links to the trades involved and to a rule you can verify in the Simulator before adopting it.
One priority correction with simulated recovery and independent episodes.
Behavior Score and Process Score, kept separate on purpose.
From finding to rule: simulate it, adopt it, then track adherence after every sync.
No signals and no predictions: only what happened in your trades.
Needs: enough closed trades; some detectors also need stop loss or open time.
Product interface · recorded example. Values refer to the displayed sample, not expected results.Scroll the preview or open it full screen.
Market Lab. Context, before you decide.
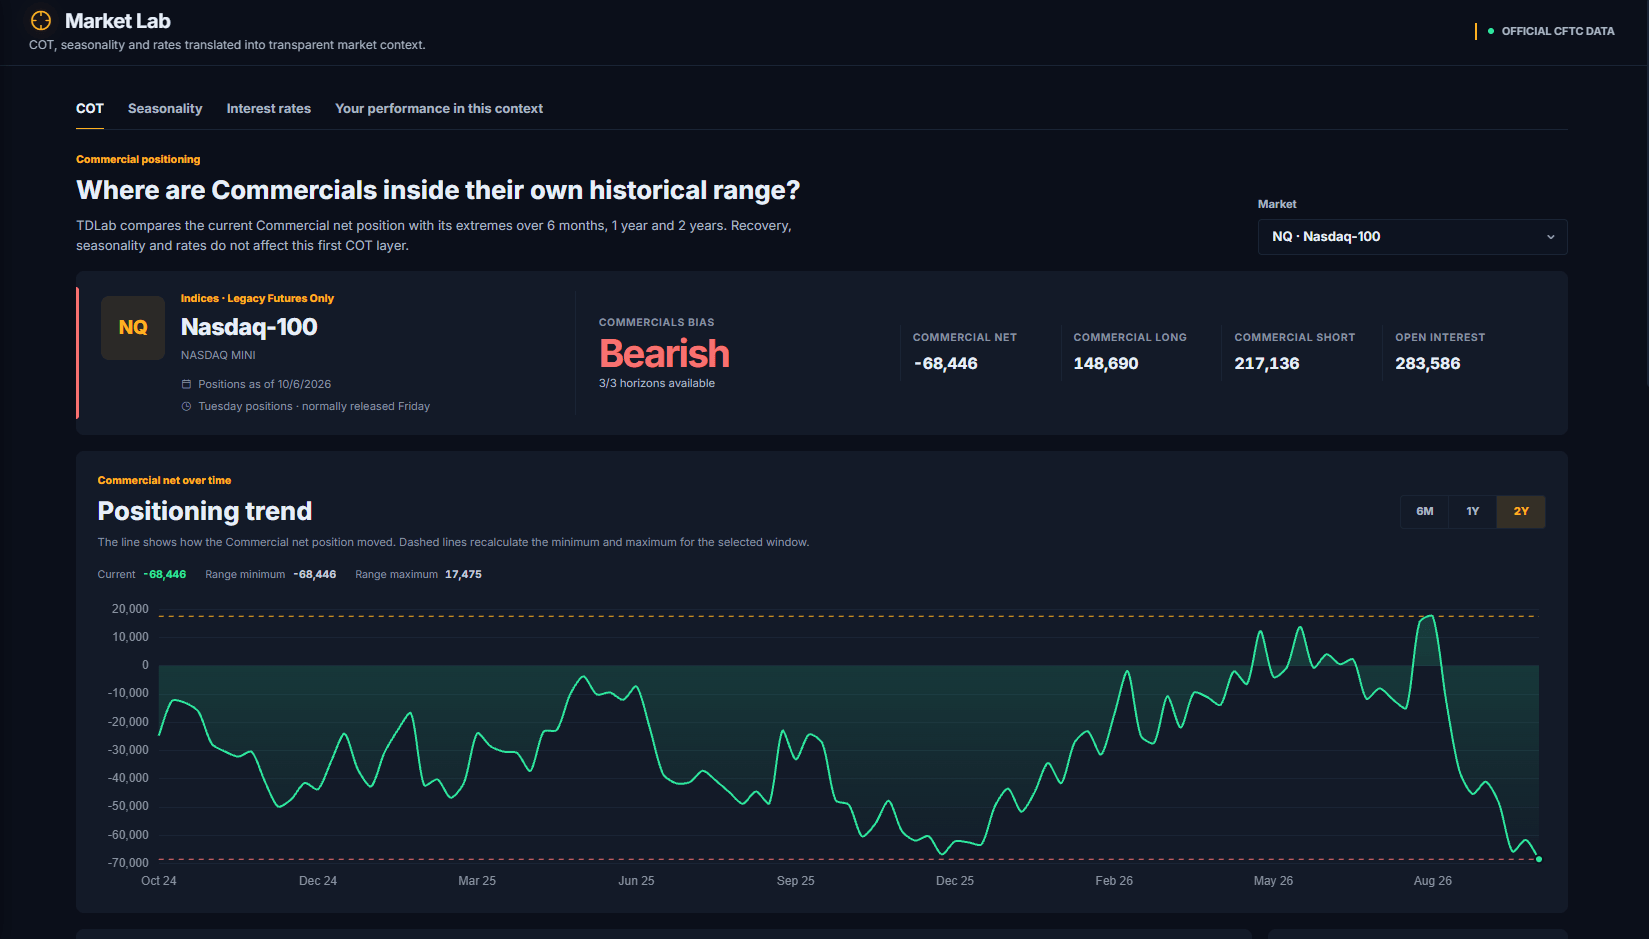
COT positioning, seasonality and central bank rates for the markets you follow, in one place. Use it on its own as a research tool or, once your trades are in, see how your results change across contexts.
COT: Commercial positioning with percentile over 6 months, 1 and 2 years.
Seasonality over 5, 10 and 20 years.
Policy rates and differentials for currencies and indices.
Your performance by context, when your trades allow it.
Works without imported trades; the personal comparison needs them.
Have a partner code? Enter it at checkout. The total with your country's taxes is shown at checkout.
Before you start.
Answers to the most common questions, and what the terms you'll see in TDLab mean.
Is it useful if I'm already profitable?
Yes. Follow each strategy by version, compare new trades against a baseline and catch early when execution or results start to change. You don't need to start from a problem.
Does it work with prop-firm accounts?
Yes. TDLab works with the platform, not the broker: if your challenge runs on MT4, MT5, cTrader or another supported platform, you import the trades like any other account.
How do I import my trades?
With automatic sync for MT4, MT5 and cTrader, or by uploading your platform's export file. Every format has a step-by-step guide in Docs.
Which platforms do you support?
MT4, MT5 and cTrader, including automatic sync. TradingView, Tradovate and NinjaTrader through their export files. For anything else there's the custom CSV import. Don't see yours? Ask us to support it.
Do I need a stop loss on every trade?
No. Most analyses work with closed trades alone. Stop loss and open time unlock a few extra checks, such as risk: TDLab tells you which ones instead of guessing them.
Do simulations predict future results?
No. The Rule Simulator replays a rule on your past trades and tells you whether the effect stands out from noise. No signals, no predictions, no orders blocked on your platform.
What does the free trial include?
14 days without a card, with every module except Market Data and AI chat: 1 account, 100 trades, 10 simulations and 200 MB of attachments. No automatic charge when it ends.
Can I cancel or get a refund?
You can cancel anytime: renewal stops and access stays active until the end of the period. On your first payment you can ask for a refund within 14 days by contacting support.
Is my data safe?
We don't sell your data or share it with other users. You can turn on two-factor authentication, export everything or delete your account at any time.
R (R multiple)
A result expressed in multiples of your initial risk. +2R means you made twice what you risked.
Expected Value
What you expect on average from each trade, in R: (win rate × average win) − (loss rate × average loss).
Profit factor
Gross profit divided by gross loss. Above 1, a strategy makes more than it loses.
Win rate
The share of trades closed in profit. On its own, it doesn't tell you whether a strategy works.
Drawdown
The largest drop from a previous account peak. It measures how painful the path to the result was.
Baseline
A frozen reference: a version's trades and metrics at a given moment, compared with the trades that follow.
Setup Adherence
How often you followed your strategy's steps, based on your Trade Review answers.
Risk Adherence
Whether you respected the limits declared before the session, such as max trades and max loss.
Independent episode
A separate repetition of a behavior. Trades close together in time count as a single episode, so one bad afternoon doesn't count as ten.
Cooldown
A pause after a loss: for N minutes you don't open new trades.
Distinguishable from noise
The simulated improvement is large enough that chance alone can't explain it, at 90% confidence.
COT · Commercials
The CFTC's weekly report on futures positioning. Commercials are participants hedging a real business exposure.
Seasonality
How a market has moved on average through the year, over 5, 10 or 20 years.
Your tradesalready have the answers.
Import them and see what they've been telling you.